October 26, 2017
Unequal Opportunities: Fewer Resources, Worse Outcomes for Students in Schools with Concentrated Poverty
Persistent gaps in test scores and college enrollment between students from low income families and other more financially secure students are well documented, as are the challenges schools face in trying to improve student outcomes. Too often, these disparities are seen as inevitable and the challenges insurmountable. Increased investments are characterized as wasteful, rather than necessary. Yet, there are concrete and measurable deficiencies in the educational opportunities available to students in high poverty schools.
This report takes an in-depth look at resources and classes available at over 1,800 public schools across Virginia. The findings are clear: students who have fewer resources outside of the school building are getting shortchanged in the classroom as well. And the differences are striking.
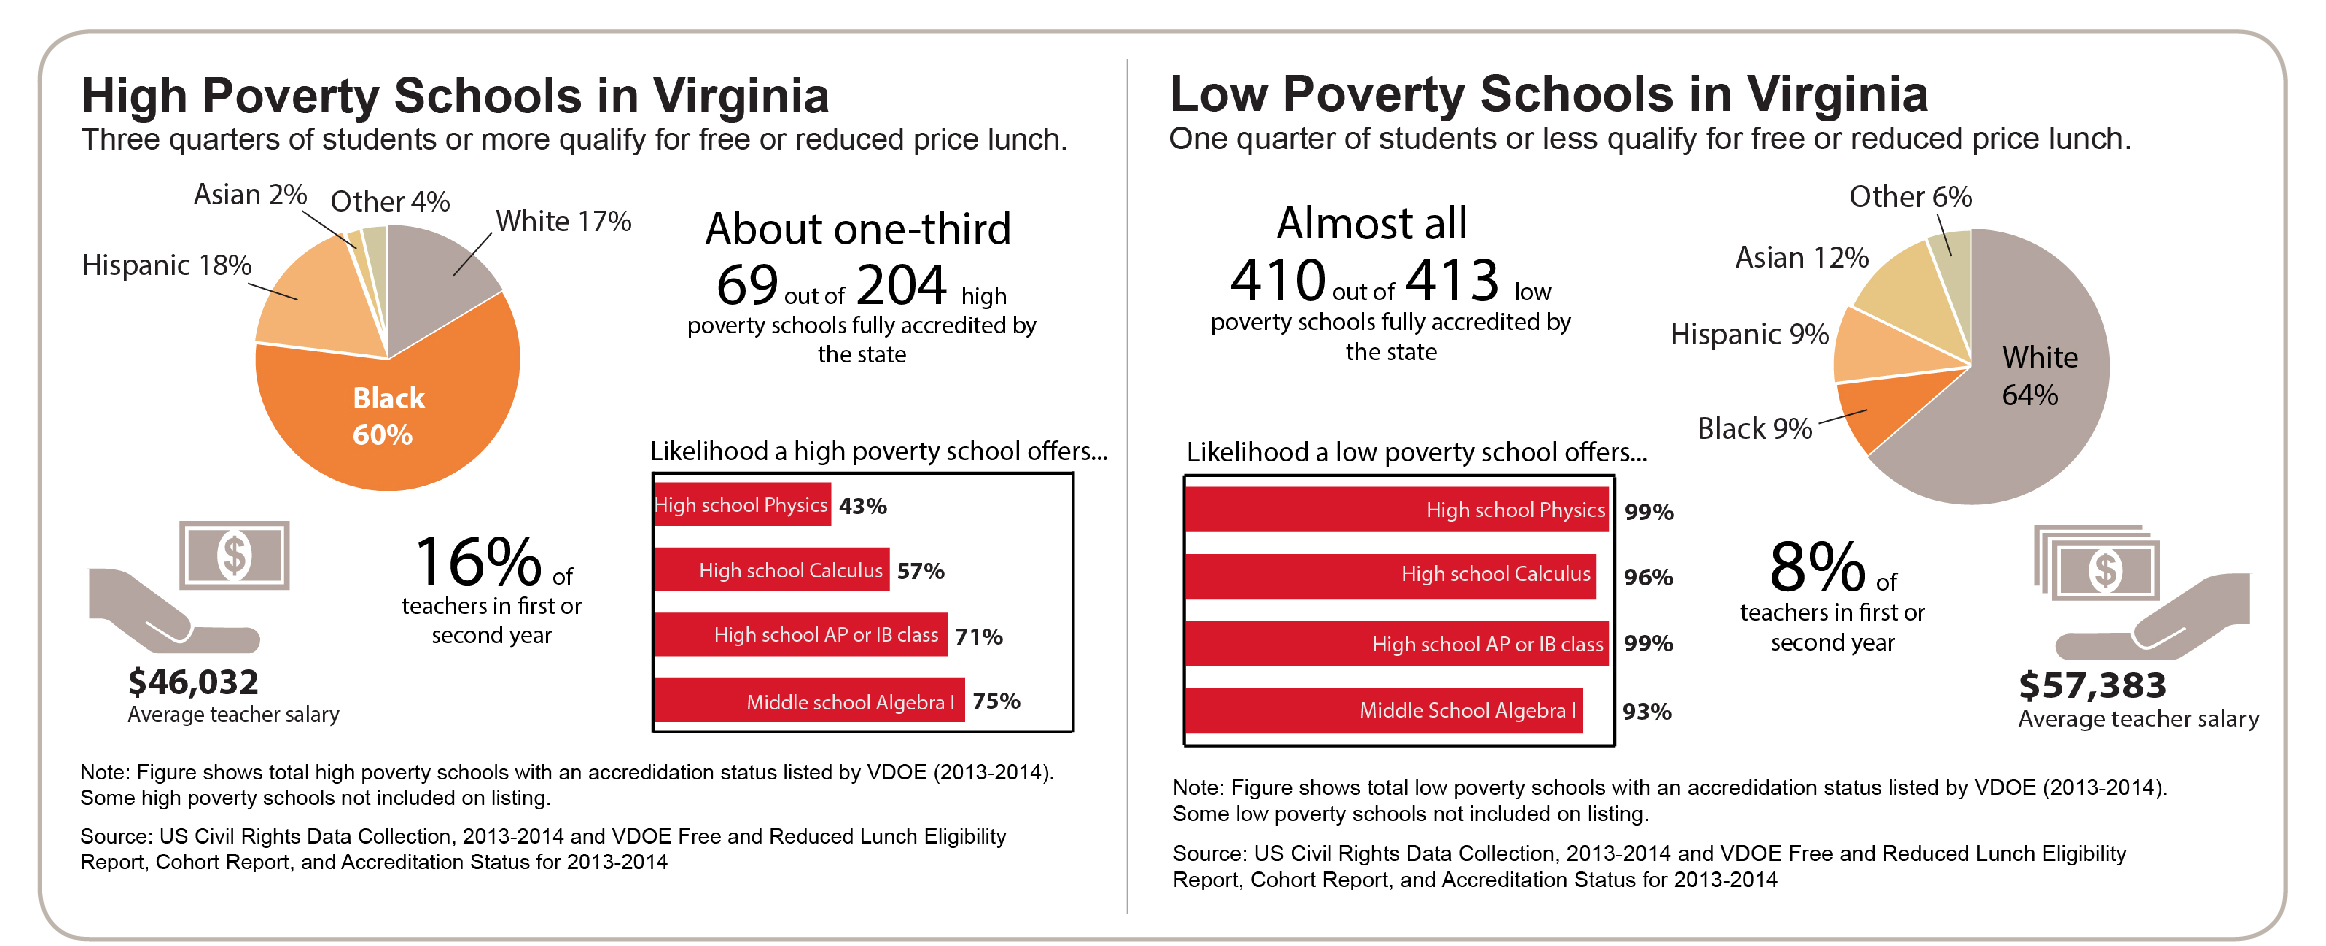
Students in high poverty schools have less experienced instructors, less access to high level science, math, and advanced placement courses, and lower levels of state and local spending on instructors and instructional materials. The average teacher salary in high poverty schools was about $46,000 in the 2013-2014 school year compared to over $57,000 in low poverty schools. The students are the ones who feel the impact of these disparities, and the consequences are worse outcomes when it comes to attendance, school performance, and graduation rates. Only about one third of high poverty schools were fully accredited by the state.
This is tragic because it’s precisely in these schools that heightened funding can have the biggest impact, and it’s high poverty communities that could benefit most from having more skilled, better educated workers.
It’s largely Virginia’s Black and Hispanic students that are being deprived of the opportunity to pursue their goals and career ambitions. That’s because students of color are extremely over-represented in high poverty schools. About one out of every six students of color (15 percent) in Virginia attended a high-poverty school in the 2013-2014 school year, as did more than one out of every five (22 percent) Black students — compared to just 3 percent of White students.
Alarmingly, these challenges are not shrinking — they are becoming more widespread across the state. The number of schools with high concentrations of students from low-income families has doubled since the 2002-2003 school year, while enrollment in these schools has more than doubled.
The lack of sufficient resources and offerings represents a lost opportunity for our children, communities, and the future economy of Virginia. This needs to be addressed by Virginia leaders by better targeting resources to high poverty schools and by promoting enrollment policies that encourage racially and economically diverse schools. At the same time, they should also be skeptical of using public funds for private schools, particularly if funding is not targeted to low income students or the benefit is inadequate for tuition as that can further segregate schools.
Fewer Resources and Opportunities in High Poverty Schools
High poverty schools in Virginia have less experienced teachers, lower teacher salaries, are less likely to have critical math, science, and advanced coursework, spend less per student on instructors and instructional materials with state and local dollars, and have fewer advanced courses. All of this shows that students in high poverty schools — many of whom have fewer resources and supports outside of the school building — are also getting less in the classroom. And, it’s largely students of color that are feeling these impacts.
Teacher Experience
Years of research has documented the challenges schools with concentrated poverty face in attracting and recruiting teachers and helping students succeed in the classroom. The unfortunate result is less experienced teachers in the classrooms of students with the greatest needs; and this is certainly true in Virginia. In 2013-2014, 16 percent of teachers in Virginia’s high poverty schools were in their first or second year of teaching at any school. This is twice the percentage for schools with the lowest concentrations of poverty – where only 8 percent of teachers were in their first or second year of teaching. In these low poverty schools, one quarter of students or fewer qualify for free or reduced price lunch.
The rate of first or second year teachers is even higher (17 percent) for high poverty schools that also have high percentages of students of color.
Instructional Spending
Teachers in high poverty schools also earn lower average salaries compared to low poverty schools, likely in part because of this discrepancy in teacher experience. The average teacher salary in high poverty schools was about $46,000 in 2013-2014 school year compared to over $57,000 in low poverty schools.
Overall, there is lower instructional spending from the state and localities per student in high poverty schools than low poverty schools. High poverty schools spent 10 percent less per student on instructors (teachers and aides), instructional materials, and professional development than low poverty schools using state and local resources in 2013-2014. That means Virginia is investing less on instruction in schools with students that start out with less and have greater needs outside of the classroom. High poverty schools with high percentages of students of color had even lower per student spending on instruction.
Course Offerings
High poverty middle schools and high schools are also less likely to offer advanced coursework compared to schools with low concentrations of poverty. For example, the vast majority of middle schools (93 percent) with low concentrations of poverty offered Algebra I, while only three quarters (75 percent) of middle schools with high concentrations of poverty offered this key course for building foundational math skills and creating a gateway to higher level math. It is also a required course for acceptance at some specialty high schools such as some of Virginia’s Governor’s schools. Similarly, almost all high schools with low concentrations of poverty were able to provide Calculus and Physics, which are important admissions criteria for many colleges and universities. Meanwhile, in high poverty high schools, only 57 percent offered Calculus and less than half (43 percent) offered Physics.
And, it’s not just the math and sciences — students in high poverty high schools are also less likely to offer any Advanced Placement (AP) or International Baccalaureate (IB) class. Less than three quarters (71 percent) of high poverty high schools offered at least one AP or IB class compared to 99 percent of low poverty high schools. For those high poverty high schools that did offer an AP or IB class, they offered only about half as many –about 10 on average — than low poverty high schools, which offered 19 of these classes on average.
Worse Outcomes in High Poverty Schools
There are clear consequences to providing fewer resources to students in high poverty schools. Students in high poverty schools do worse on standardized tests, are more likely to be chronically absent during the school year, more likely to be held back in their grade, and less likely to graduate on-time.
Only one-third (34%) of high poverty schools in Virginia were fully accredited by the state in 2013-2014 compared to almost all (99%) of low poverty schools. This stark contrast shows the unequal outcomes on test performance that result from giving students with some of the greatest needs the fewest resources and supports. Meanwhile, the percentage of accredited high poverty schools that also have high percentages of students of color was even lower — just 29 percent.
Attendance is another challenge and particularly for students from low income families that may need to care for a younger sibling or family member or that move frequently. Students in high poverty schools were twice as likely to be chronically absent as students in low poverty schools — 16 percent of students compared to only 8 percent, respectively. Chronic absenteeism has been shown to have significant negative impacts on student performance and graduation rates. This includes negative impacts on math and reading scores as early as kindergarten, and is correlated to lower assessment scores in later grades. Chronic absenteeism also diminishes one’s eagerness to learn, increases feelings of isolation, and is an early indicator of dropping out of high school.
Students in high poverty schools are also less likely to advance to the next grade level and graduate high school on time. The rate of students failing to advance to the next grade level was three times higher in high poverty schools (3 percent) compared to low poverty schools (1 percent). These attendance and retention challenges can lead to students dropping out of school or not graduating high school on time.
Virginia Schools Increasingly Segregated — by Income and Race
These sobering challenges facing high poverty schools are affecting an increasing number of students in Virginia. And at the same time, students of color are vastly over-represented relative to their share of Virginia’s student population, with Black and Hispanic students increasingly segregated into these high poverty schools.
Virginia has 212 public schools with extremely high concentrations of students from low-income families — more than one out of ten (11.6 percent) of Virginia’s public schools. These are schools in which at least three quarters of students qualify for free or reduced price lunch, indicating a family income of $43,568 or less for a family of four (2013-2014). These high poverty schools enrolled 107,000 students that school year (the last year that all Virginia schools reported information on students qualifying for free or reduced price lunch).
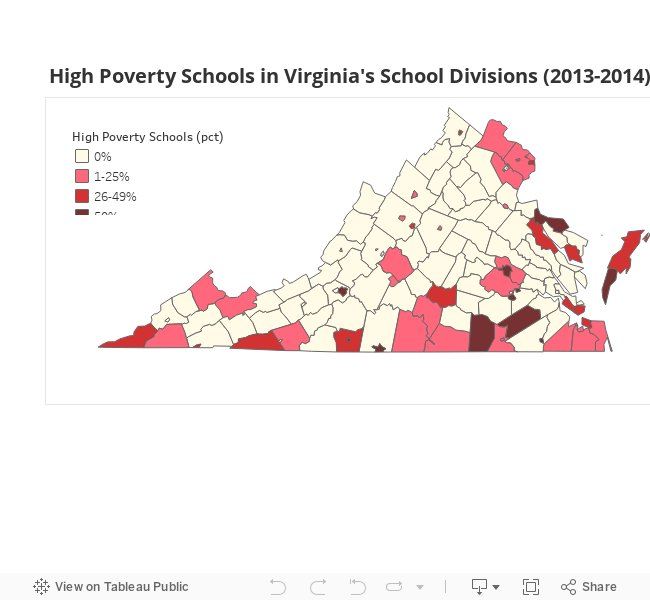
High poverty schools are located all across the state, although they are most concentrated in the Greater Richmond and Hampton Roads regions — two areas of the state with high percentages of Virginia’s Black population. Richmond City has the most of any division with 29, and almost two-thirds (63%) of students in the division are enrolled in one of these high poverty schools. Other divisions with many high poverty schools include Norfolk (20 high poverty schools), Roanoke City (12), Prince William (11), Newport News (11), Danville (10), Hampton (8), and Henrico (8).
In Petersburg, almost all of their schools (7 out of their 8) met the criteria for high poverty in the 2013-2014 school year. That’s the same number of high poverty schools as Fairfax County — where 7 out of almost 200 schools were high poverty.
Among those enrolled in high poverty schools, 83 percent are students of color, with Black students (60 percent) and Hispanic students (18 percent) as the largest racial/ethnic groups. White students made up only 17 percent of the students in high poverty schools, while they represented over half (52 percent) of students enrolled in Virginia’s public schools that year. About one out of every six students of color (15 percent) in Virginia attended a high-poverty school in the 2013-2014 school year, as did more than one out of every five (22 percent) of Black students. In contrast, only three out of one hundred White students (3 percent) attended a high poverty school that year.
The problem of economic and racial segregation in Virginia schools is getting worse. The number and percentage of Virginia schools with high concentrations of students from low-income families has increased over the last ten years. The number of high poverty schools has doubled, increasing from 106 in the 2002-2003 school year to 212 in 2013-2014. Enrollment has more than doubled increasing from 44,000 students to 107,000 over the same period.
And, it’s not just the overall number of students in high poverty schools that’s increasing, the percentage of students in a high poverty school is increasing too — meaning students are increasingly likely to be in a school of concentrated poverty. The percentage of students in a high poverty school more than doubled from 2003-2004 to 2013-2014 increasing from 3.9 percent up to 8.5 percent of students. This increase is particularly noticeable for Black students in Virginia. Only one in 10 Black students (10 percent) attended a high poverty school in 2002-2003, yet a little over ten years later that percentage has grown to over one out of every five Black students (22 percent).
The increasing economic segregation in Virginia schools mirrors a national trend of rising residential segregation in neighborhoods across the country. As income inequality grows, it allows high income families to sort themselves into higher cost neighborhoods. Nationwide, this has resulted in the rate of high income families that live in predominantly high income neighborhoods doubling from 1980 to 2010. In Virginia, where cities are independent of their surrounding counties, this can often take the form of families moving to suburban communities in a surrounding or nearby county. For example, stark differences in income and poverty can be seen across school division lines in places like Richmond City and Chesterfield and Henrico counties or Charlottesville and Albemarle County.
How to Level the Playing Field
State and local leaders need to take decisive action if they are going to improve resources and opportunities for students in high poverty schools and ensure all Virginia’s students can succeed in the classroom and chase their career ambitions.
Targeted State Financial Support
One of the tools the state has available is a funding program called the At-Risk Add-On. This program targets additional state assistance to school divisions based on their concentration of students eligible for free lunch. These funds can be used by schools to offer competitive salaries so they can attract and retain teachers or to provide additional instruction for struggling students.
The state should boost support for the At-Risk Add-On to increase resources to high-poverty school divisions and put us more in line with other states. This could be achieved by increasing the per student weight that is attached to students from low-income families. Currently, the state provides 1 to 13 percent more for each low-income student, with school divisions with higher concentrations of poverty getting more and divisions with lower concentrations getting less. To put us more in line with other states, we should increase this program up to 1 to 25 percent more per low-income student. Making this adjustment would almost double the state’s add-on funding, increasing state support by a total of $84 million dollars a year.
Virginia should also examine how it funds schools more broadly. Many states have commissioned cost studies to determine how much more needs to be allocated to give all students similar educational opportunities. Virginia should review the additional cost of educating low-income students, too.
This is needed because the research shows money has the largest impact in education when it’s directed to high-poverty areas. Several recent studies show that increased K-12 funding in many states during the 1970s through 2000s resulted in notably improved achievement by low-income students. Sustained investment in K-12 schools has been shown to improve children’s performance in the classroom and increase their future earnings, with students from low income families showing more pronounced benefits. For example, a recent study published in the Quarterly Journal of Economics shows that when increases are sustained over a 12 year period, students are more likely to complete high school, their average adult wages goes up, and the likelihood that they’ll be living in poverty goes down.
Local Enrollment Policies
School leaders need to promote enrollment policies that encourage balanced and diverse public schools. They can do this by implementing controlled choice enrollment where parents select the public school in their division that they would like their child to attend, and divisions balance these choices with diversity factors like the percentage of students eligible for free or reduced lunch. The goal is to simultaneously promote choice and diversity. This strategy could be particularly effective at increasing diversity in public schools in the Greater Richmond area, if it is done regionally with the city and suburbs partnering together.
Free transportation for students is a necessary feature within these programs, since many students do not have access to transportation and may not choose to attend the closest school. Without free transportation, choice is only really given to those that can afford it. For example, 17 percent of households in Richmond City and 13 percent of Norfolk households do not have an available vehicle. In addition, it’s important that schools undertake extensive outreach to the community to raise awareness among parents and students about this program and to ensure that all families who are interested are able to participate.
State leaders could help promote these practices by offering planning and implementation grants to interested school divisions.
School districts around the country have implemented versions of controlled-choice and they have been effective at increasing diversity in public schools. For example, the merged city-suburban school district of Louisville and Jefferson County in Kentucky started controlled choice in the 1990’s allowing students to transfer out of neighborhood schools so that all schools would enroll a student body between 15 – 50 percent Black — about 15 percentage points above or below the overall enrollment of Black students in the district. The school district has been able to meet diversity goals for the vast majority of its schools while receiving broad support from parents and students. A 2011 survey found that nine out of ten parents agreeing that school district’s guidelines should “ensure that students learn with students from different races and socioeconomic backgrounds.”
Private School Options
In contrast, state and local leaders should be skeptical of solutions that seek to redirect funds for public education to private schools through private school vouchers or educational savings accounts. There is little evidence that private school vouchers improve student achievement, with a large portion of the most rigorous studies finding no statistically significant effect for participating students and a recent study finding negative impacts.
Private school vouchers and educational savings accounts can be particularly harmful if they are designed in ways that exclude students from low income families. For example, in many programs, the dollar value of the voucher falls far below private school tuition costs, and when you factor in additional costs like transportation and uniforms, it effectively excludes students from low-income families. At the same time, not all programs target funds to students from low-income families or with special education needs. The result is a public subsidy to families who can already afford the majority of private school costs at the exclusion of those who can’t. That’s a recipe for making the challenges of high poverty schools worse, not better.
Conclusion
All Virginia students deserve a high quality education and the opportunity to chase their career ambitions. Yet, an increasing number of students, and students of color in particular, find themselves in under-resourced schools with inexperienced instructors, limited coursework, and fewer instructional resources.
By allowing these disparities to continue and even worsen, we are creating barriers for striving students that will affect the opportunities available to them for the rest of their lives — and will affect their ability to contribute to their own success and to their communities in the future. By improving funding and increasing school diversity, we can take down those barriers and start to give everyone a fair shot at the life they want to live.
Definitions of Terms Used in this Report
High poverty school — Schools where 75 percent or more of the students qualify for free or reduced price lunch — a family income below $43,568 for a family of four in 2013-2014.
Low poverty school — Schools where 25 percent or less of the students qualify for free or reduced price lunch in 2013-2014 school year.
Methodology Notes
The analysis includes 1,833 public schools across the state. The list is limited to those public schools with information available in VDOE student enrollment data, VDOE free and reduced lunch data, and Office of Civil Rights (OCR) Civil Rights Data Collection for 2013-2014. This excludes some schools identified by VDOE as operating in Virginia. Notable exclusions include Virginia’s academic-year governor’s schools. The ethnic category Hispanic is used, rather than Latino because that is the classification used by VDOE.
Data Sources
Virginia Department of Education (VDOE) Free and Reduced Price Lunch Eligibility Report, VDOE Fall Membership data, VDOE Cohort Reports for 2002-2003 and 2013-2014 and the US Office for Civil Rights (OCR) Civil Rights Data Collection (CRDC) Educational Equity Report for 2013-2014.